Libertyville’s Computer Scientist: George Huber and His Predictive March Madness Model

Last month, Senior George Huber took a shot at using data science and computer programming to predict the bracket for the NCAA Men’s Basketball Tournament. This process included downloading statistics, analyzing these stats to find patterns, and creating formulas to account for those patterns.
Huber produced a program that predicted the tournament with incredible accuracy, including the correct National Champion.
“I created a model that used data from every college basketball game since 1985 and used that to predict the March Madness tournament,” said Huber. “I’ve been wanting to do a project like this for years.”
Huber received all of this data from an open-source website called Kaggle. The datasets contained the results and stats from each and every college basketball game since 1985.
“It has points scored, points against, rebounds, turnovers and everything,” Huber explained. “It ended up being around 100,000 lines of code.”
It is impossible for a human to parse through all of this data in a reasonable amount of time, but with the right programmer running the operation, a computer can accomplish this feat in the blink of an eye.
Once the computer has parsed through all of the data, Huber used the analytics to make charts and notice patterns that he could code into the predictive formula.
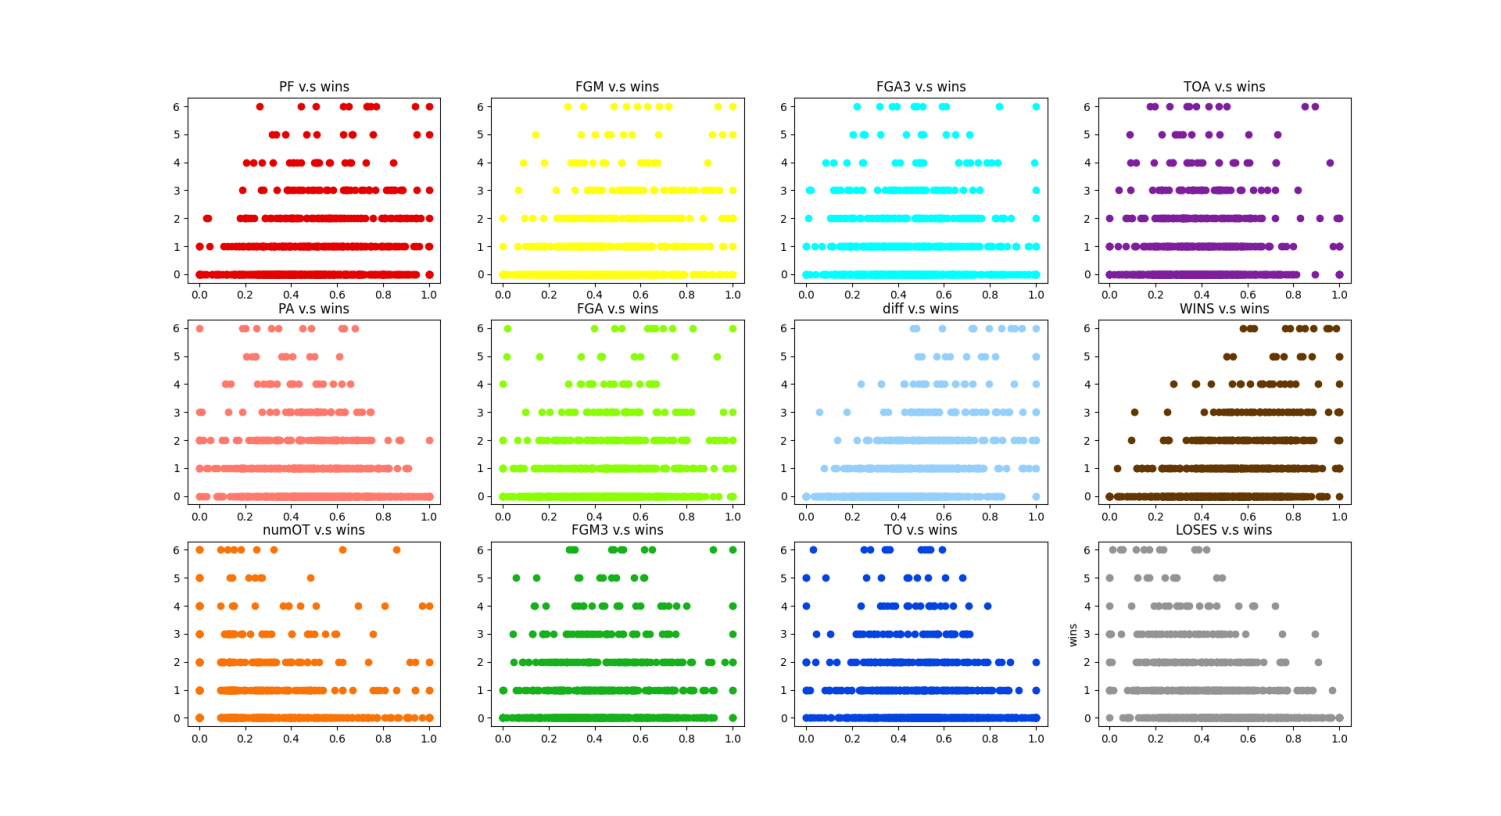
(Natalie Isberg)
“To create the model, I studied the charts. For example, in the turnovers per game chart, I found that teams that win in the tournament typically fall within the 50th percentile of the league in turnovers,” Huber explained. “So then I found an equation which would match that pattern. I used this equation to predict the likelihood of those teams making it to one of the top rounds based on that stat.”
Huber ended up including twelve analytics into his final formula. Wins, losses, points scored, points against, point differential, field goals attempted, field goals made, field goals against, three-pointers made, turnovers, turnovers forced, and number of overtimes.
His goal was to produce a model that was able to correctly score more than 50 percent of the bracket scoring points. This score is calculated by giving 10 points for correct picks in Round 1, 20 in Round 2, 40 in Round 3, and continuing to double all the way up to 320 for correctly picking the champion in Round 6. This system provides a maximum possible total of 1920 and rewards bracket predictors for correctly predicting later round games.
“ESPN has a model with an insanely high average percent of bracket points,” Huber said. “They score up in the 85th percentile but they have a team of developers working year round. I knew I wasn’t going to beat them but I wanted to get at least 50 percent so better than random chance.”
This enormous undertaking was completed by Huber in only three days. He inserted the data for the formula after the bracket was released on Selection Sunday, March 13. Then, he finished all of the coding before the first game started on Thursday, March 17.
After running a multitude of simulations, Huber blew his goal out of the water. His average was 63.5 percent of the total points and his final, “ultimate model” scored 60 percent.
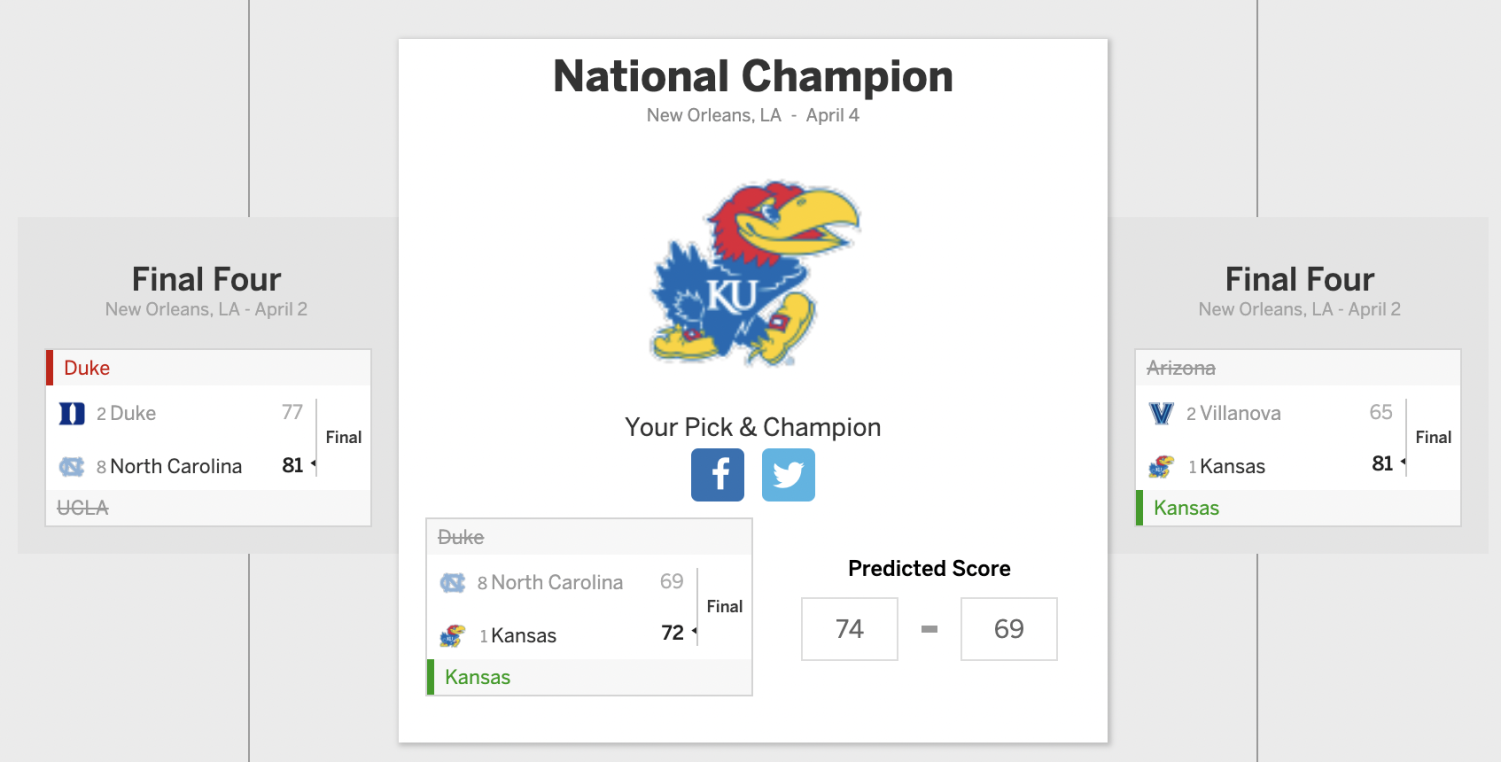
“The most popular championship matchup my model gave was Kansas over Duke,” Huber explained.
It turned out that Kansas won the National Championship and Duke made it all the way to the Final Four. Despite Kansas and Duke’s low seeds, Gonzaga, Arizona, Kentucky and a few other teams were picked as favorites over these two by a majority of the public.
“Even if it doesn’t necessarily generate the exact outcome, just the principle of doing it this way with data science is what’s cool for me,” Huber concluded. “Because in the end, March Madness is random to a certain extent.”
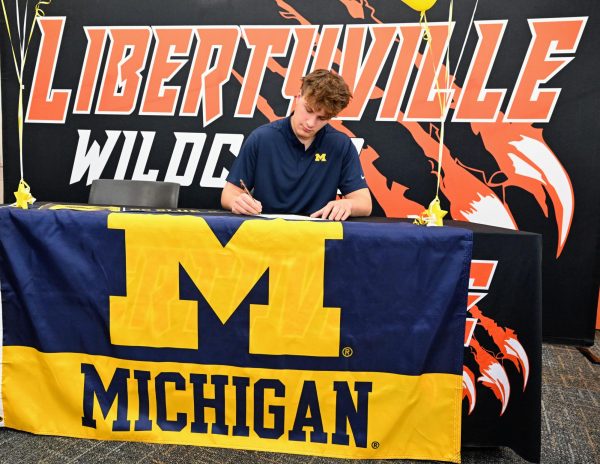
Next year, Huber will be taking his talents to the University of Illinois at Urbana-Champaign as a Computer Science major.